Investment
-

단위 : 억KRW
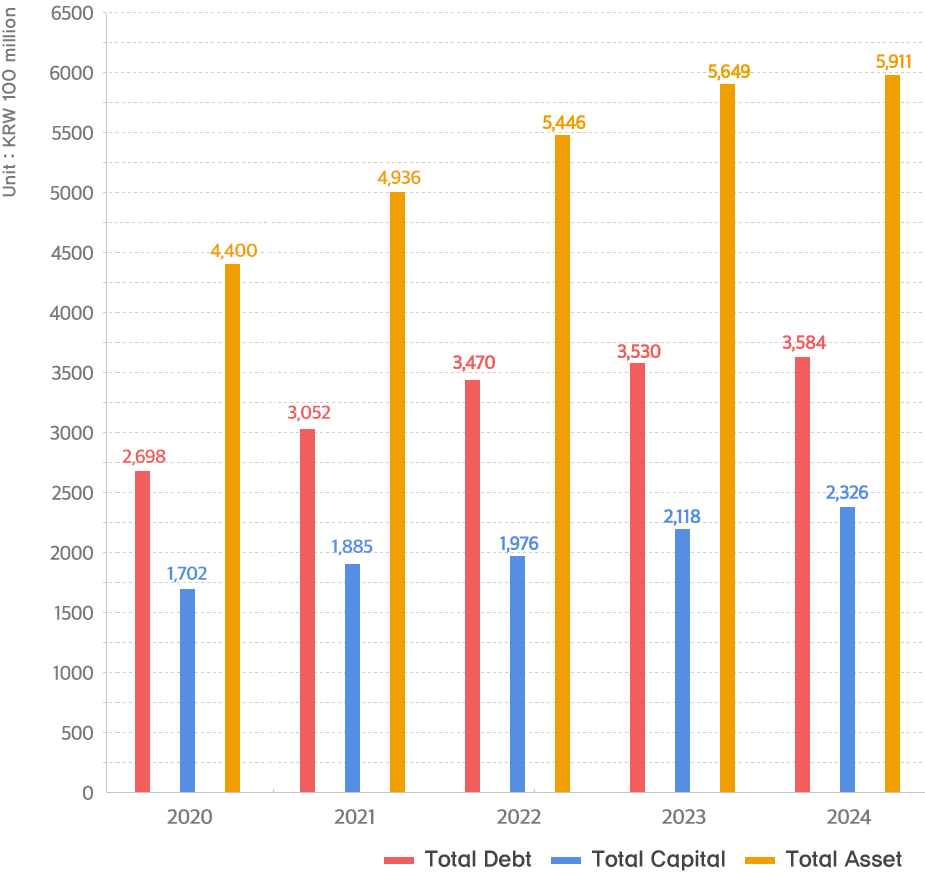
Financial Statement Category 2020 2021 2022 2023 2024 Total Liabilities and Stockholders Equity 4,400 4,936 5,446 5,649 5,911 Current Asset 2,493 2,969 3,303 3,561 3,828 Non-current Asset 1,907 1,967 2,143 2,088 2,083 Total Assets 4,400 4,936 5,446 5,649 5,911 Current Liabilities 2,106 2,630 3,048 3,207 3,369 Noncurrent Liabilities 593 422 422 324 216 Total Liabilities 2,698 3,052 3,470 3,530 3,584 Capital 107 107 107 107 107 Capital Surplus 115 112 112 112 112 Other Capital Surplus -176 -93 -53 -31 60 Earned Surplus 1,590 1,692 1,741 1,862 1,970 Non-controlling Interests 66 67 69 68 77 Total Stockholders Equity 1,702 1,885 1,976 2,118 2,326 -

단위 : 억KRW
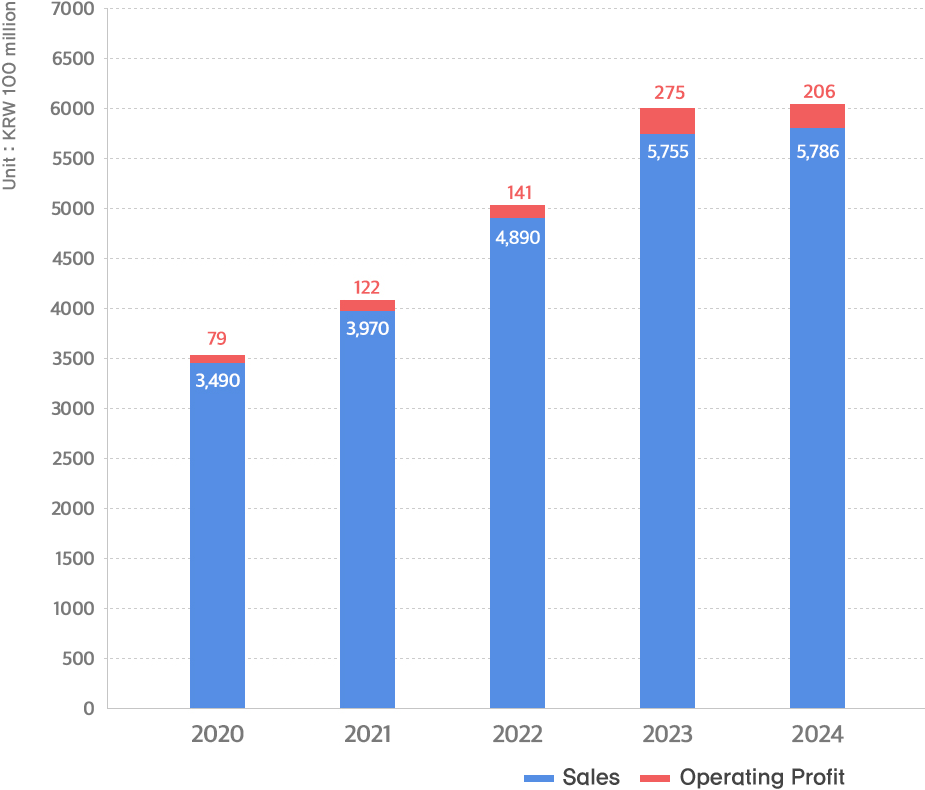
Income Statement Category 2020 2021 2022 2023 2024 Sales 3,490 3,970 4,890 5,755 5,786 Gross Profit 715 830 985 1,114 1,138 Selling Expense and General Administrative Expense 636 708 844 839 932 Operating Profit 79 122 141 275 206 Pretax Profit 21 148 68 178 246 Net Profit -23 104 8.6 142 174

 한국어
한국어 english
 中文
中文 español
 Português


